

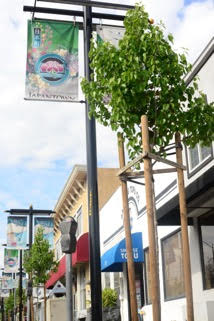
To maintain the health of municipal forests, city foresters are as much "managers of risk" as they are arborists. They work to lower the risk of catastrophic tree losses by planting a diverse mix of species that are well-adapted to the location. Ideally, the species they choose are not all vulnerable to the same pests, what researchers call “pest overlap.” That way, a smaller percentage of the inventory will be at risk should an infestation occur. Maintaining age diversity is important, too. Annual plantings lower the municipal forest’s average age and ensure both stability and continual benefits from its trees.
The US Forest Service, which studies both national and city forests, devised a “report card concept” that it uses to assess risk in municipal forests nationwide. They are graded on four criteria: Species Dominance, Age Structure, Pest Threat, and Potential Asset Loss.

San Jose received a B+ for species diversity on its 2011 report card even though two species, Sycamore or London Plane Tree and Chinese Pistache each represented more than 10 percent of the inventory. A more recent inventory of street trees, compiled by San Jose’s City Arborist in 2014, shows a less concentrated makeup; no one species comprises more than 6.45 percent of the 154,551 trees counted:
Species Inventory Percentage
Chinese pistache - 6.45%
Sycamore or London plane - 6.05%
Crape myrtle - 5.43%
Liquidambar - 5.22%
Zelkova - 2.26%
Southern magnolia - 2.05%
Ginkgo biloba - 1.66%
Purple-leaf plum - 1.6 %
Callery pear - 1.6 %
Camphor - 1.49%
Besides street trees, the City has two other municipal inventories that have a combined total of 35,586 trees. One is a record of trees planted on street medians and alongside major thoroughfare known as “backups.” (Our City Forest in recent years has organized many plantings of this sort, such as along Branham Lane, Monterey Highway, Meridian Avenue, N. 5th Street and others.) The second inventory concerns trees planted in so-called “special districts”.

Because the City has yet to count park trees and is unable to venture on private property, much of San Jose’s urban forest is not reflected on these City tree counts. Thus, it is important to distinguish between the municipal forest, which comprises only a portion of the broader urban forest. Indeed, according to a 2013 study of San Jose’s urban forest conducted by the University of California Davis, US Forest Service, and the University of Vermont--data was gathered through satellite images and geographic information systems (GIS) rather than by manual counting--San Jose has an estimated 1.6 million trees. Each has an average crown diameter of 22.75-ft., and the entire forest covers 15.4% of the 151 square miles studied. (See Qingful Xiao et al.) A question well beyond the scope of this blog is how does the urban forest, where trees are not chosen for diversity and without full knowledge of their susceptibility to pests, impact the municipal forest?

To maintain its continuity, a municipal forest should have trees of all ages with a preponderance of them young. Annual plantings ensure that younger trees are in place to replace aging ones, and the benefits of the forest, whether shade, clean air, blossoms, fruit, autumn color, or psychological balm may be enjoyed by city dwellers without interruption. Imagine the reverse: if all trees were the same age, a significant portion of the canopy would be lost by old age alone. Only volunteers would be left to carry on.

To arrive at a judicious mix of species for the forest--one that is calculated to promote longevity and minimize losses--pests have to be taken into account along with the portions of the inventory that are vulnerable to them. Arborists can determine the scope of possible infestations by creating a Pest Vulnerability Matrix (PVM), which is described by Greg McPherson and Louren Kotow of the US Forest Service:
Pest information is aggregated into complexes and each is given a severity rating of low, moderate or severe. . . . Tree species are aggregated into taxon by genus unless there are substantial differences in pest susceptibility. Several metrics are calculated by PVM: total pest count on each taxon, pest overlap (percentage of all pests found on each taxon), tree species affected and proportion of entire inventory affected.
The species that is vulnerable to the highest number of severe pests, according to McPherson and Kotow, is the Sycamore or London Plane. Other trees judged risky, either by vulnerability to a high number of severe pests alone or pests of all ratings, are evergreen oak, ash, eucalyptus, deciduous oak, and sweetgum.
If pests, species diversification, and average tree age are not enough, arborists have climate change with all of its unknown effects to worry about. Maybe the thriving, resilient tree of today will be the vulnerable one tomorrow, or trees adapted to a Mediterranean climate will falter and need to move north. Maybe unanticipated pests will like it here, although we hope not.
Further Reading:
McPherson E.G., Kotow, L. 2013. “A Municipal Forest Report Card: Results for California, USA,”
https://www.fs.fed.us/psw/publications/mcpherson/psw_2013_mcpherson002.pdf
Xiao, Q. et al.Urban Forest Inventory and Assessment Pilot Project, (Tree Canopy Study)
https://www.sanjoseca.gov/DocumentCenter/View/23211
San Jose Urban Tree Canopy - Species Count info (page 3)
http://csjdotgis.maps.arcgis.com/apps/MapJournal/index.html?appid=562b3e1073f146a4824171fbc2abf560
Tree Inventory for San José
http://gisdata-csjdotgis.opendata.arcgis.com/datasets?q=trees&sort_by=relevance